

What can you do with AntView®?
- Compare multiple antenna measurement results of different manufactures easily
- Easy comparison of BASTA parameters of different antennas of various antenna vendors
- Flexible selection of y and x axels for easy antenna test result comparison
- Upload data to the database easily
- Store test results efficiently
- Save your view settings for fast future analysis and comparison templates to save your time
- Get antenna characteristics analysis and calculations in no time
- Retrieve the results from AntView® and present them in an easily understandable format
- Easy export of the antenna test result analysis and comparisons

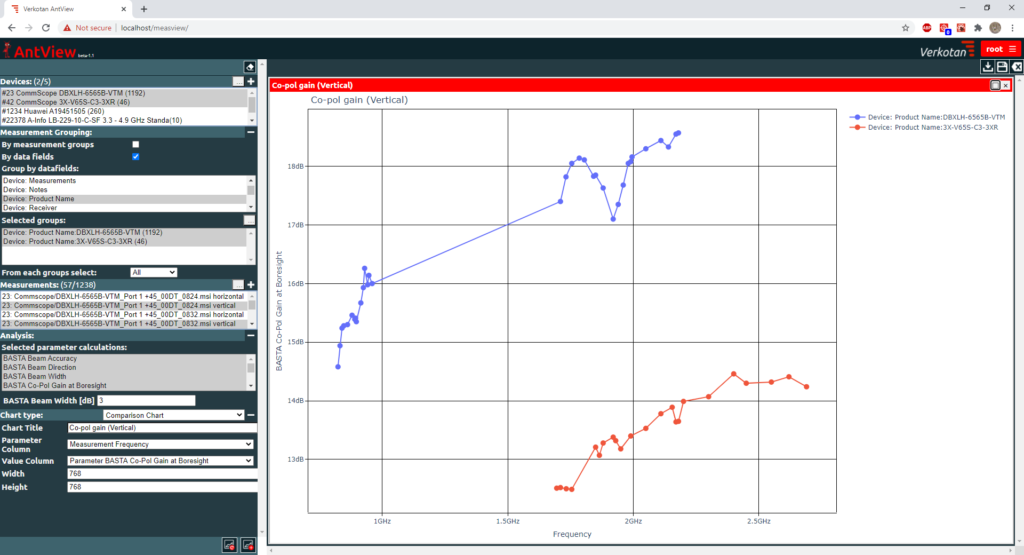
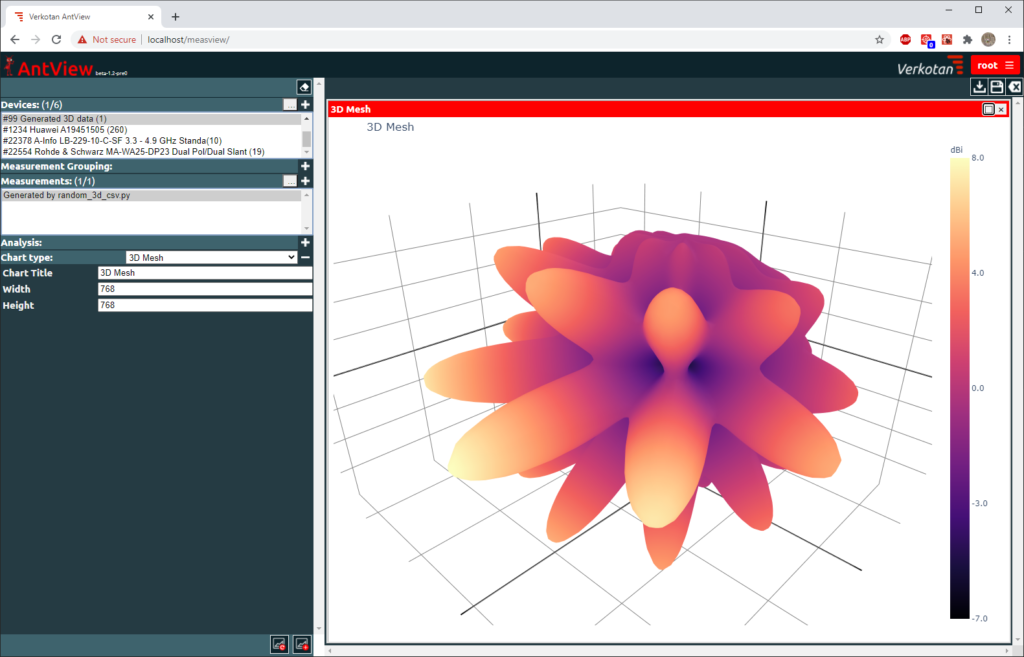
Clarity with visualization
When comparing the results, you are able to see the differences more easily and clearly, because differences are demonstrated with parameters and graphs. When presenting the data, results are visualized in an easily understandable format with colors and graphs.
How to use AntView®
Watch a quick introduction of how to use AntView®
Contact us for more information