


Continue reading to learn what you can do with AntView® or request a Demo Access and find it out by youself!
Antenna pattern analysis tool AntView
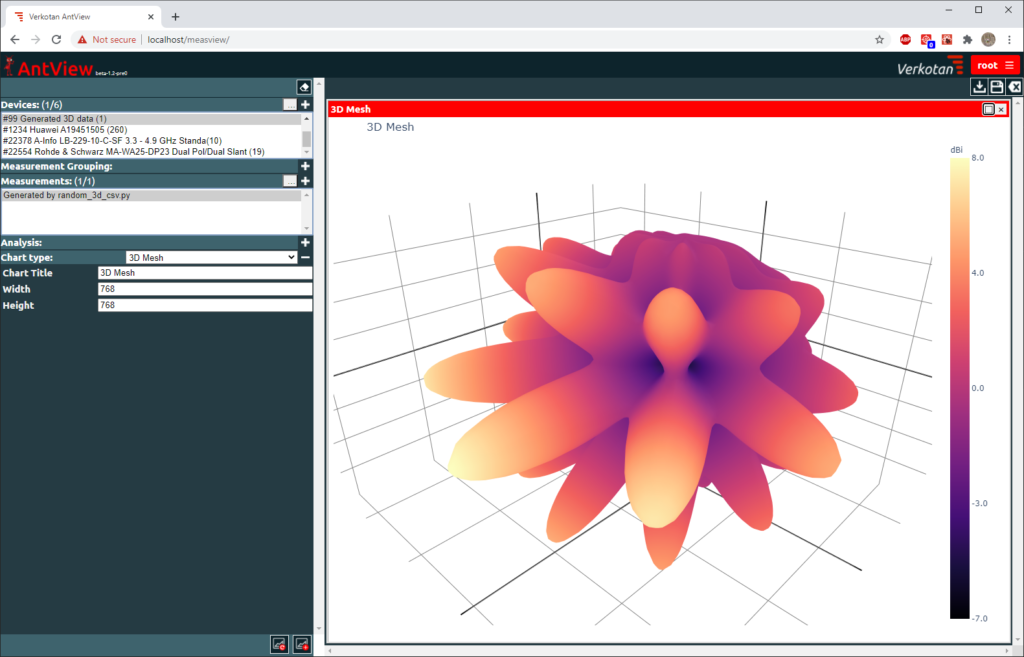
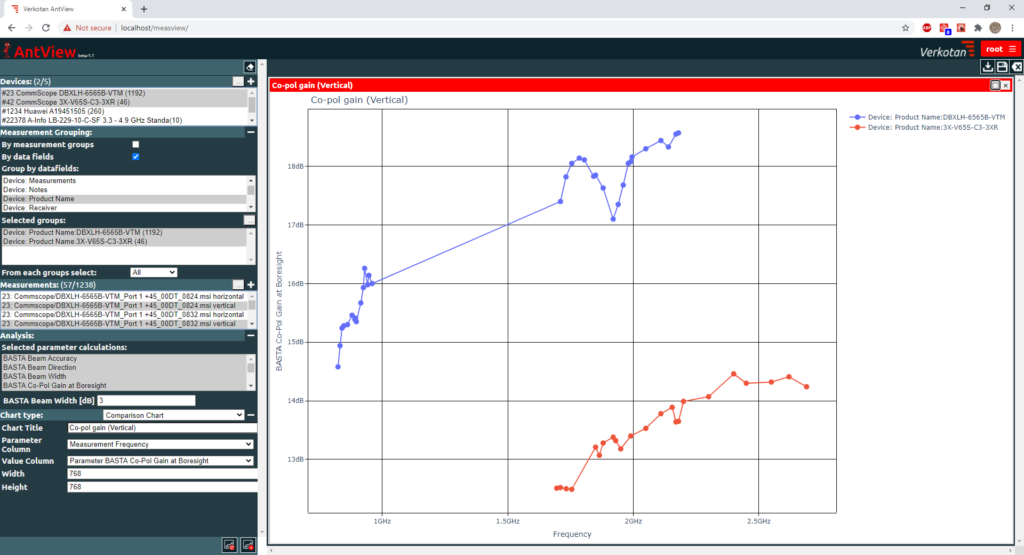
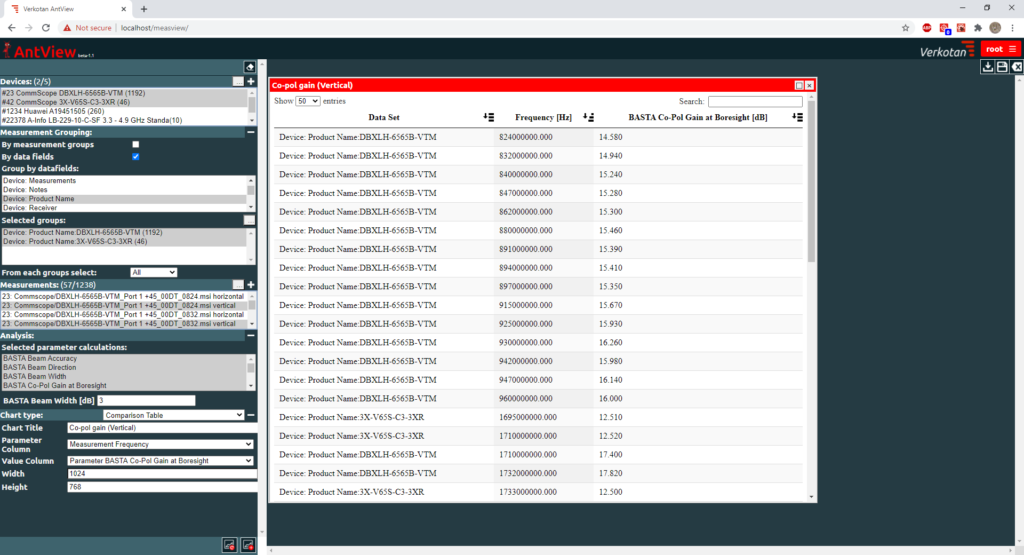
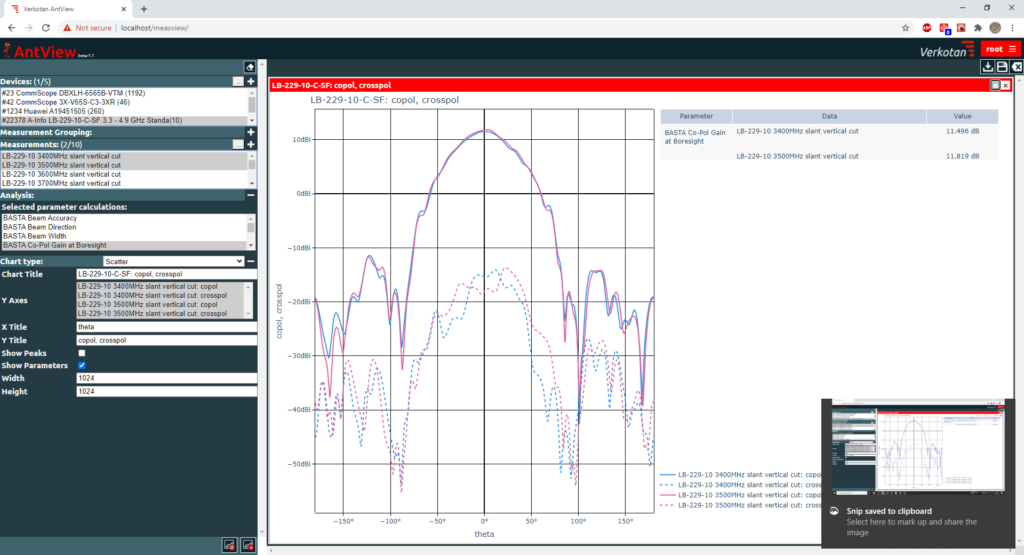
Antenna pattern analysis tool, AntView®, is one of its kind. It is developed at Verkotan laboratories since its inception. It allows reporting the antenna pattern measurements in an understandable, and organized manner. The results are reported in an easy-to-understand format with colors, graphs, and e.g., BASTA parameters.
With AntView® you can easily organize your antenna measurements and find them later. All the antenna pattern measurements can effortlessly be found in one place instead of many different software and applications. AntView® database is accessed through a web browser and cloud service, so the test results are easily accessible.
If you are interested to hear the whole story behind our data analysis tool, you can read it from our The Story Behind AntView® -news. There we go through, for example, the technologies used in AntView®.
What can you do with AntView®?
Here are some examples what you can do with AntView®:

Why AntView®
The reason why we developed AntView® is to make analysing antenna patterns easier. You no longer have to spend time fighting and programming with many different tools, instead you can centralize all the measurements in one place: our AntView® database. The purpose of AntView is to simplify the process, save your time and make analysing efficient.
We are happy to offer the free demo use for our antenna pattern analysis tool. The process how to get the demo access is very straight forward. Fill out the form to request access to the demo and we will send you the username and password for AntView® in three business days. After getting the access to the demo you can start exploring the software.
By getting the demo access you are not obligated to anything. We do not require any information other than your name, e-mail, phone number and a company name.
How to use AntView®
If you are still hesitating, look at these short introductions how to use AntView®. It is easy to use, and the results are presented in a clear format.
If you need any other information, we are always ready to help! Contact us and let’s figure out how AntView® can make your time more efficient.
Follow our social media channels to keep up with the latest news in the world of wireless technology.